The map of Delaware-sized antarctic iceberg journey to its death
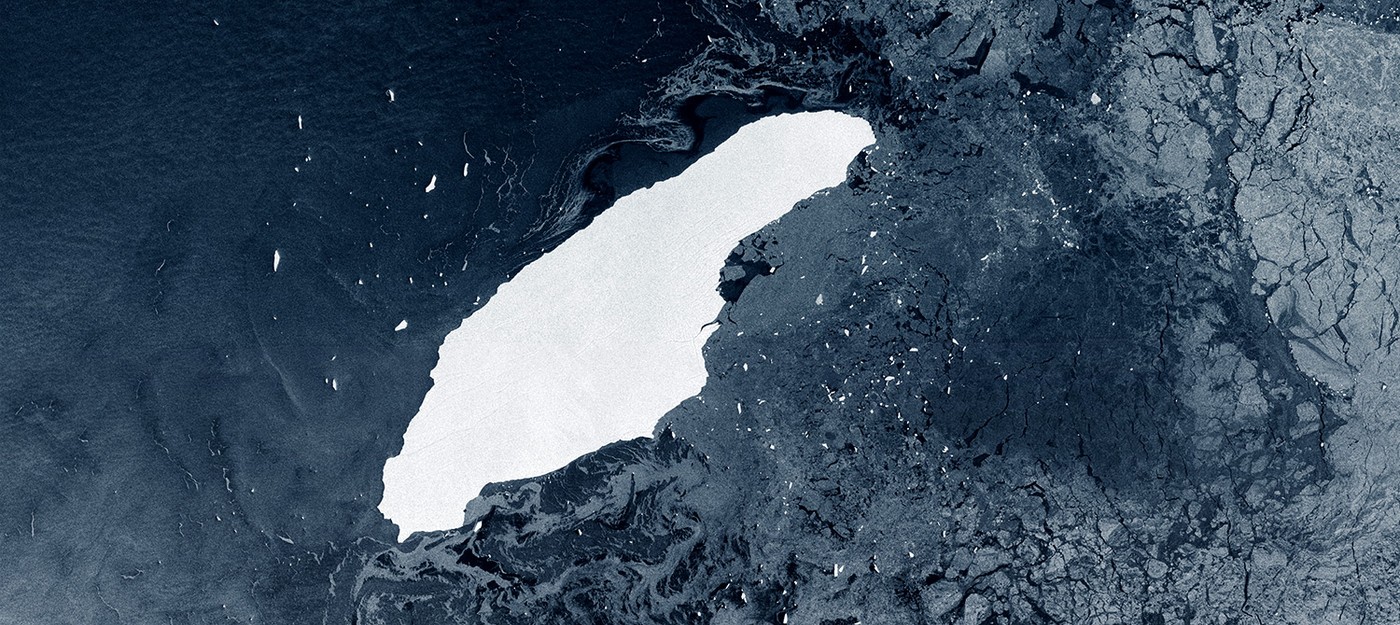
It takes years for an iceberg to "die", but as soon as it is born, an iceberg begin its great adventure to the final end. Waves chip away at its edges, air thaws it from above, and water melts it from below.
In July 2017 the largest iceberg (at the time) broke Larsen C Ice Shelf, along the east coast of the Antarctic Peninsula. It was designated as an Iceberg A-68, and with the size of nearly 2,200 square miles (5,800 square kilometers) its area was close to the size of Delaware.
Anne Braakmann-Folgmann, a doctoral candidate at the University of Leeds said in recently chronicled paper:
Icebergs are a source of cold fresh water and nutrients in the Southern Ocean. However, where and how much of this is released is not very well studied and not included in ocean models yet, especially for the largest icebergs.
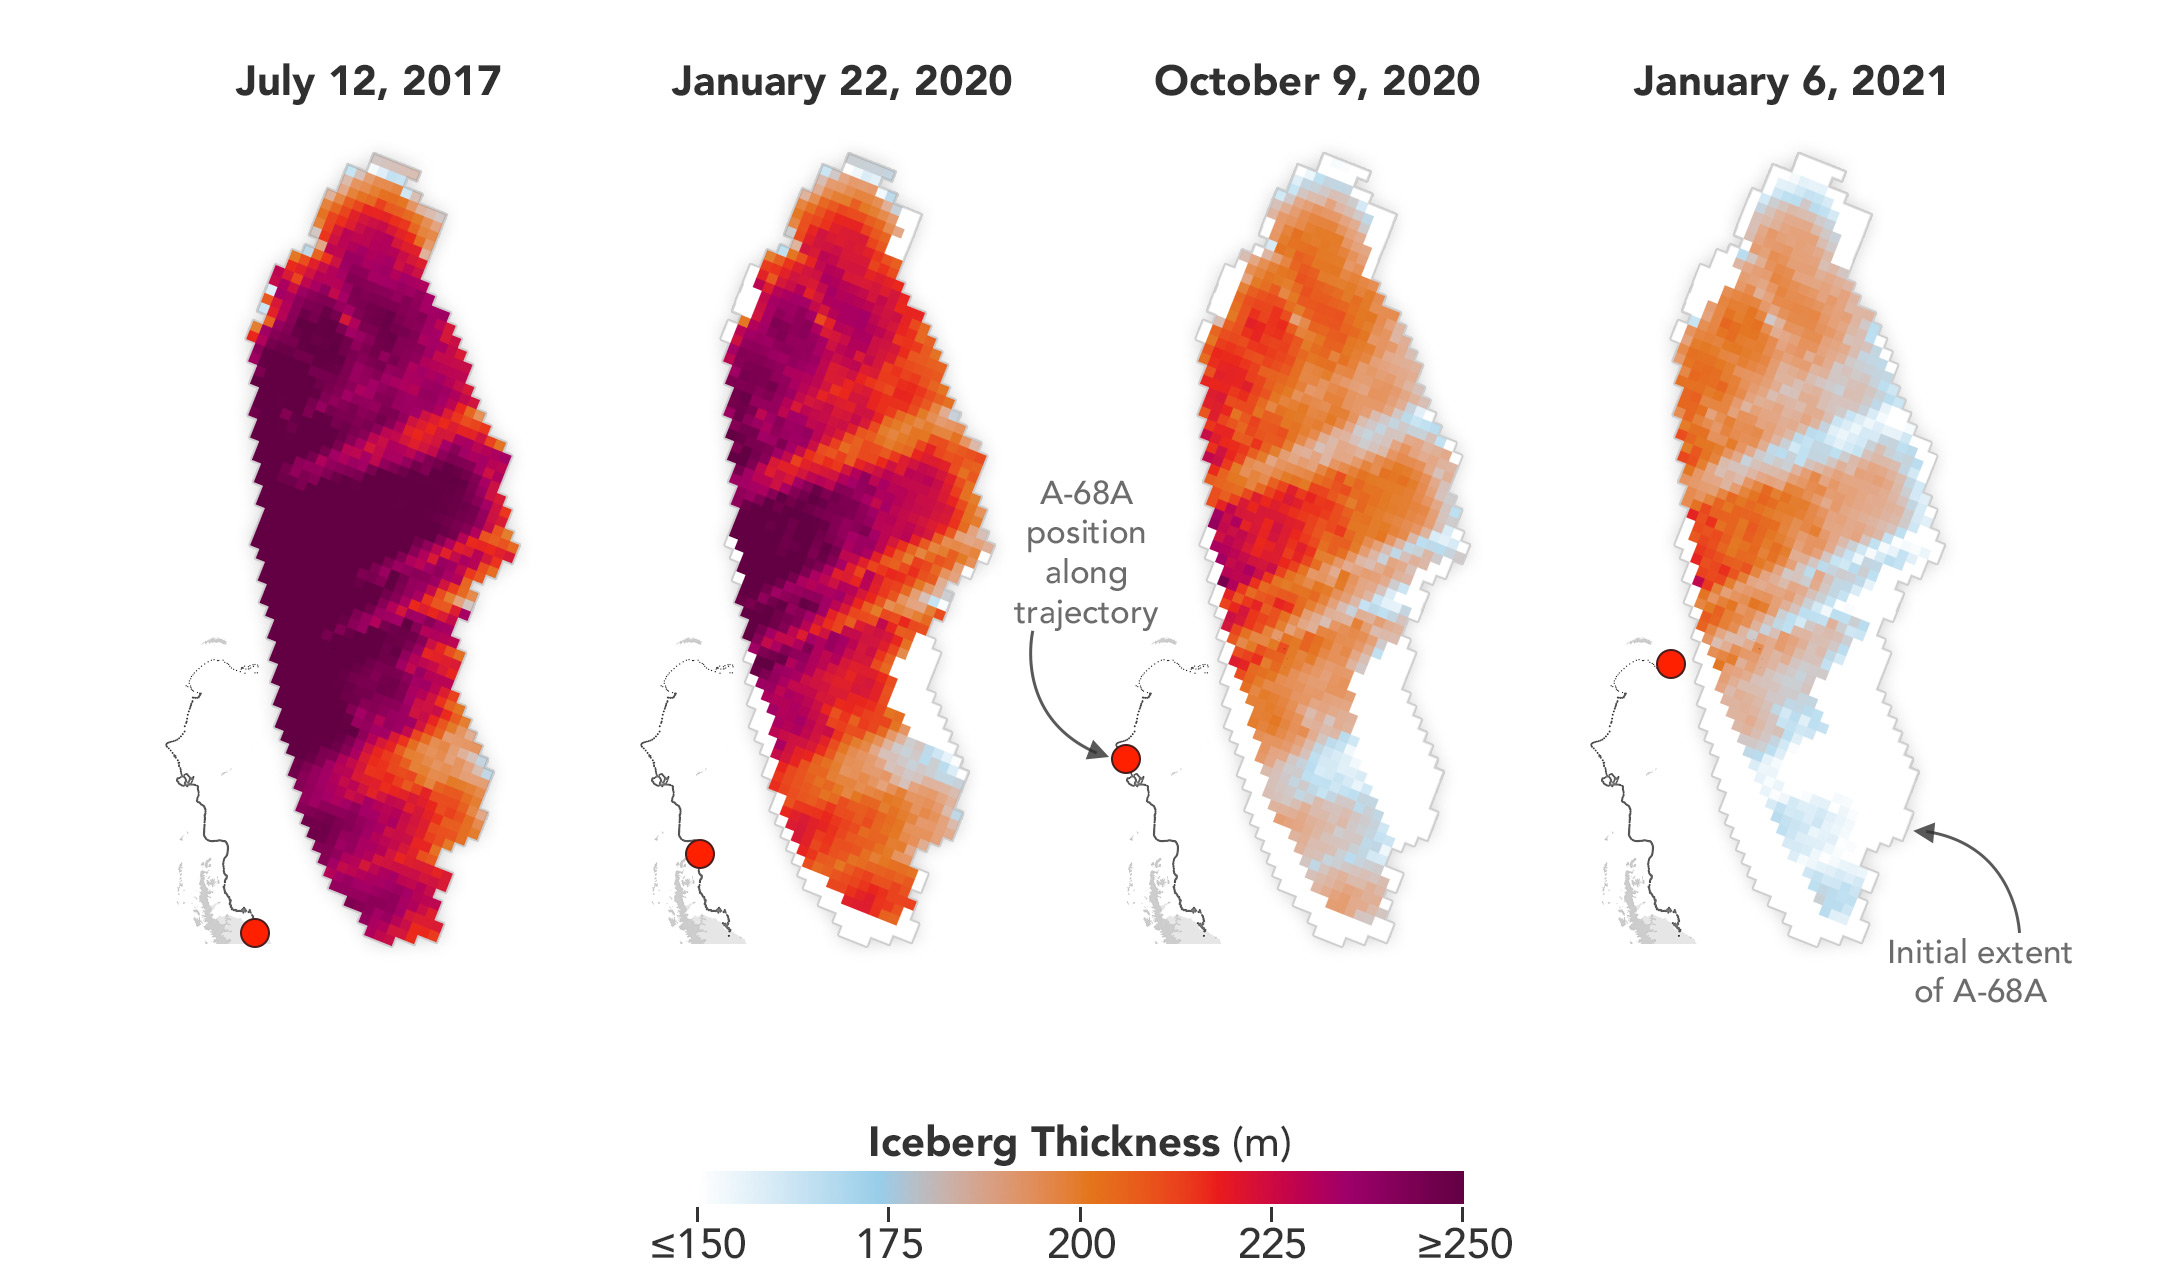
The maps above show where and when the iceberg thinned as it drifted north from the Weddell Sea into the Scotia Sea. The first heatmap (left) shows the berg’s thickness in July 2017, when it was still near the Larsen C Ice Shelf. Notice that it is thicker on its left side, where it was attached to the ice shelf, and thinner on the right side, where it was exposed to the ocean.
Its total average thickness was 235 meters at the time. As the berg drifted north, it met warmer air and water temperatures, which accelerated melting. By January 2021, when the berg closed in on South Georgia, it had thinned to an average thickness of 168 meters.
The researchers showed that from July 2017 until January 2021, melting from the bottom of the iceberg accounted for 32 percent of its loss. Melting peaked near the island of South Georgia, where the scientists estimated that 152 billion metric tons (152 billion cubic meters) of fresh water was added to the ocean — the equivalent of 61 million Olympic swimming pools — over the span of three months. Scientists are still investigating the effect of all this fresh water on local ocean properties. They also want to know if the extra nutrients supplied to the ocean by the melting iceberg fostered any biological production.
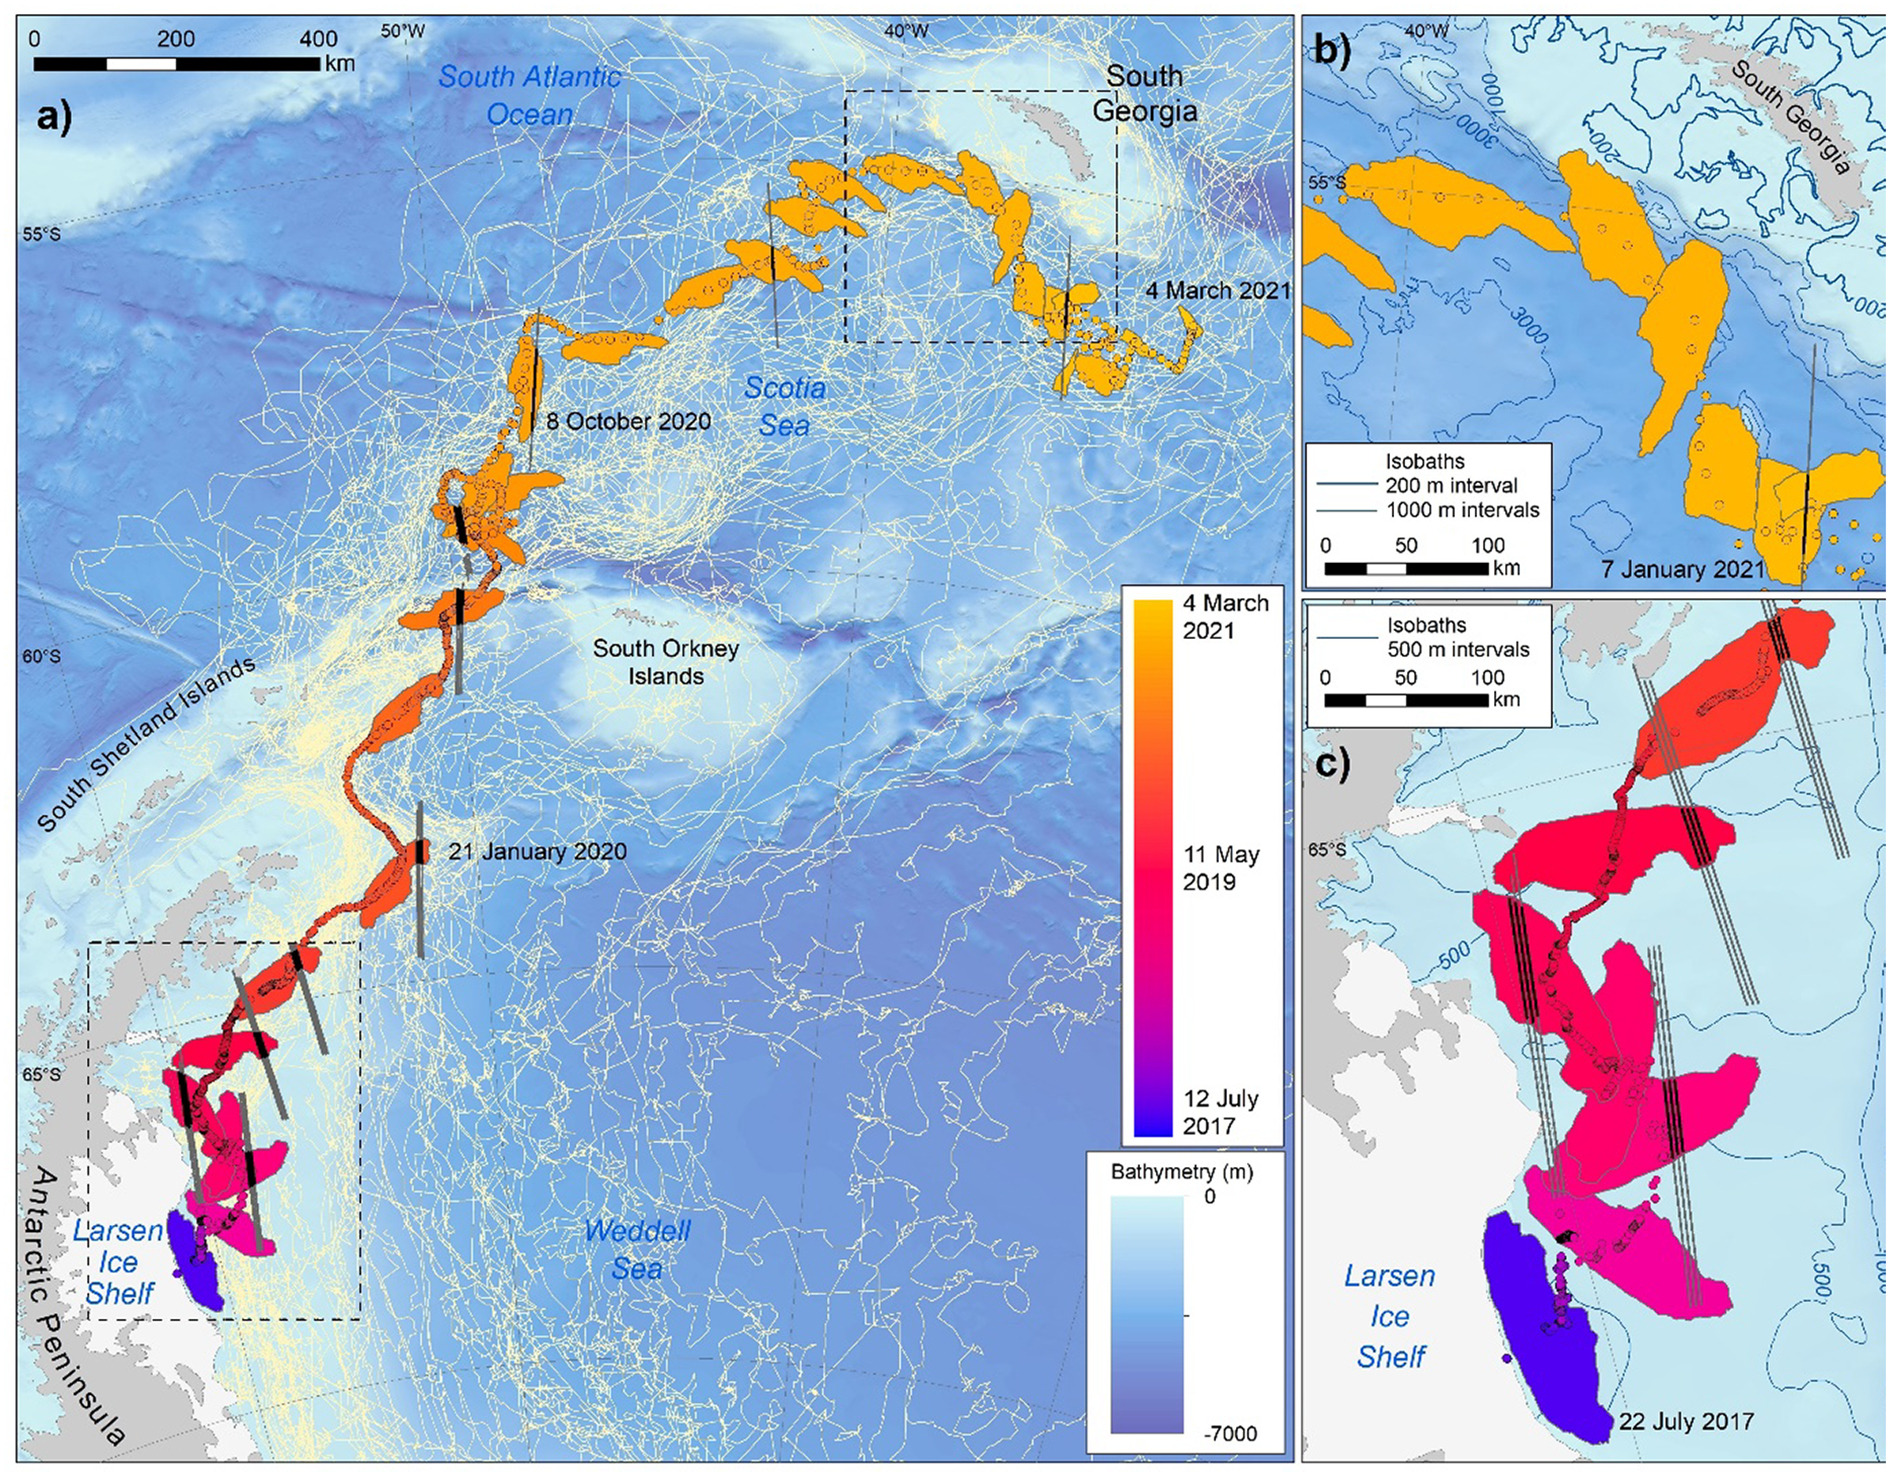
The map below show the path of an iceberg during its three and a half years journey. Thinning and fragmentation both increased as the iceberg drifted north, but fragmentation finally dominated as the iceberg disintegrated in the Northern Scotia Sea.
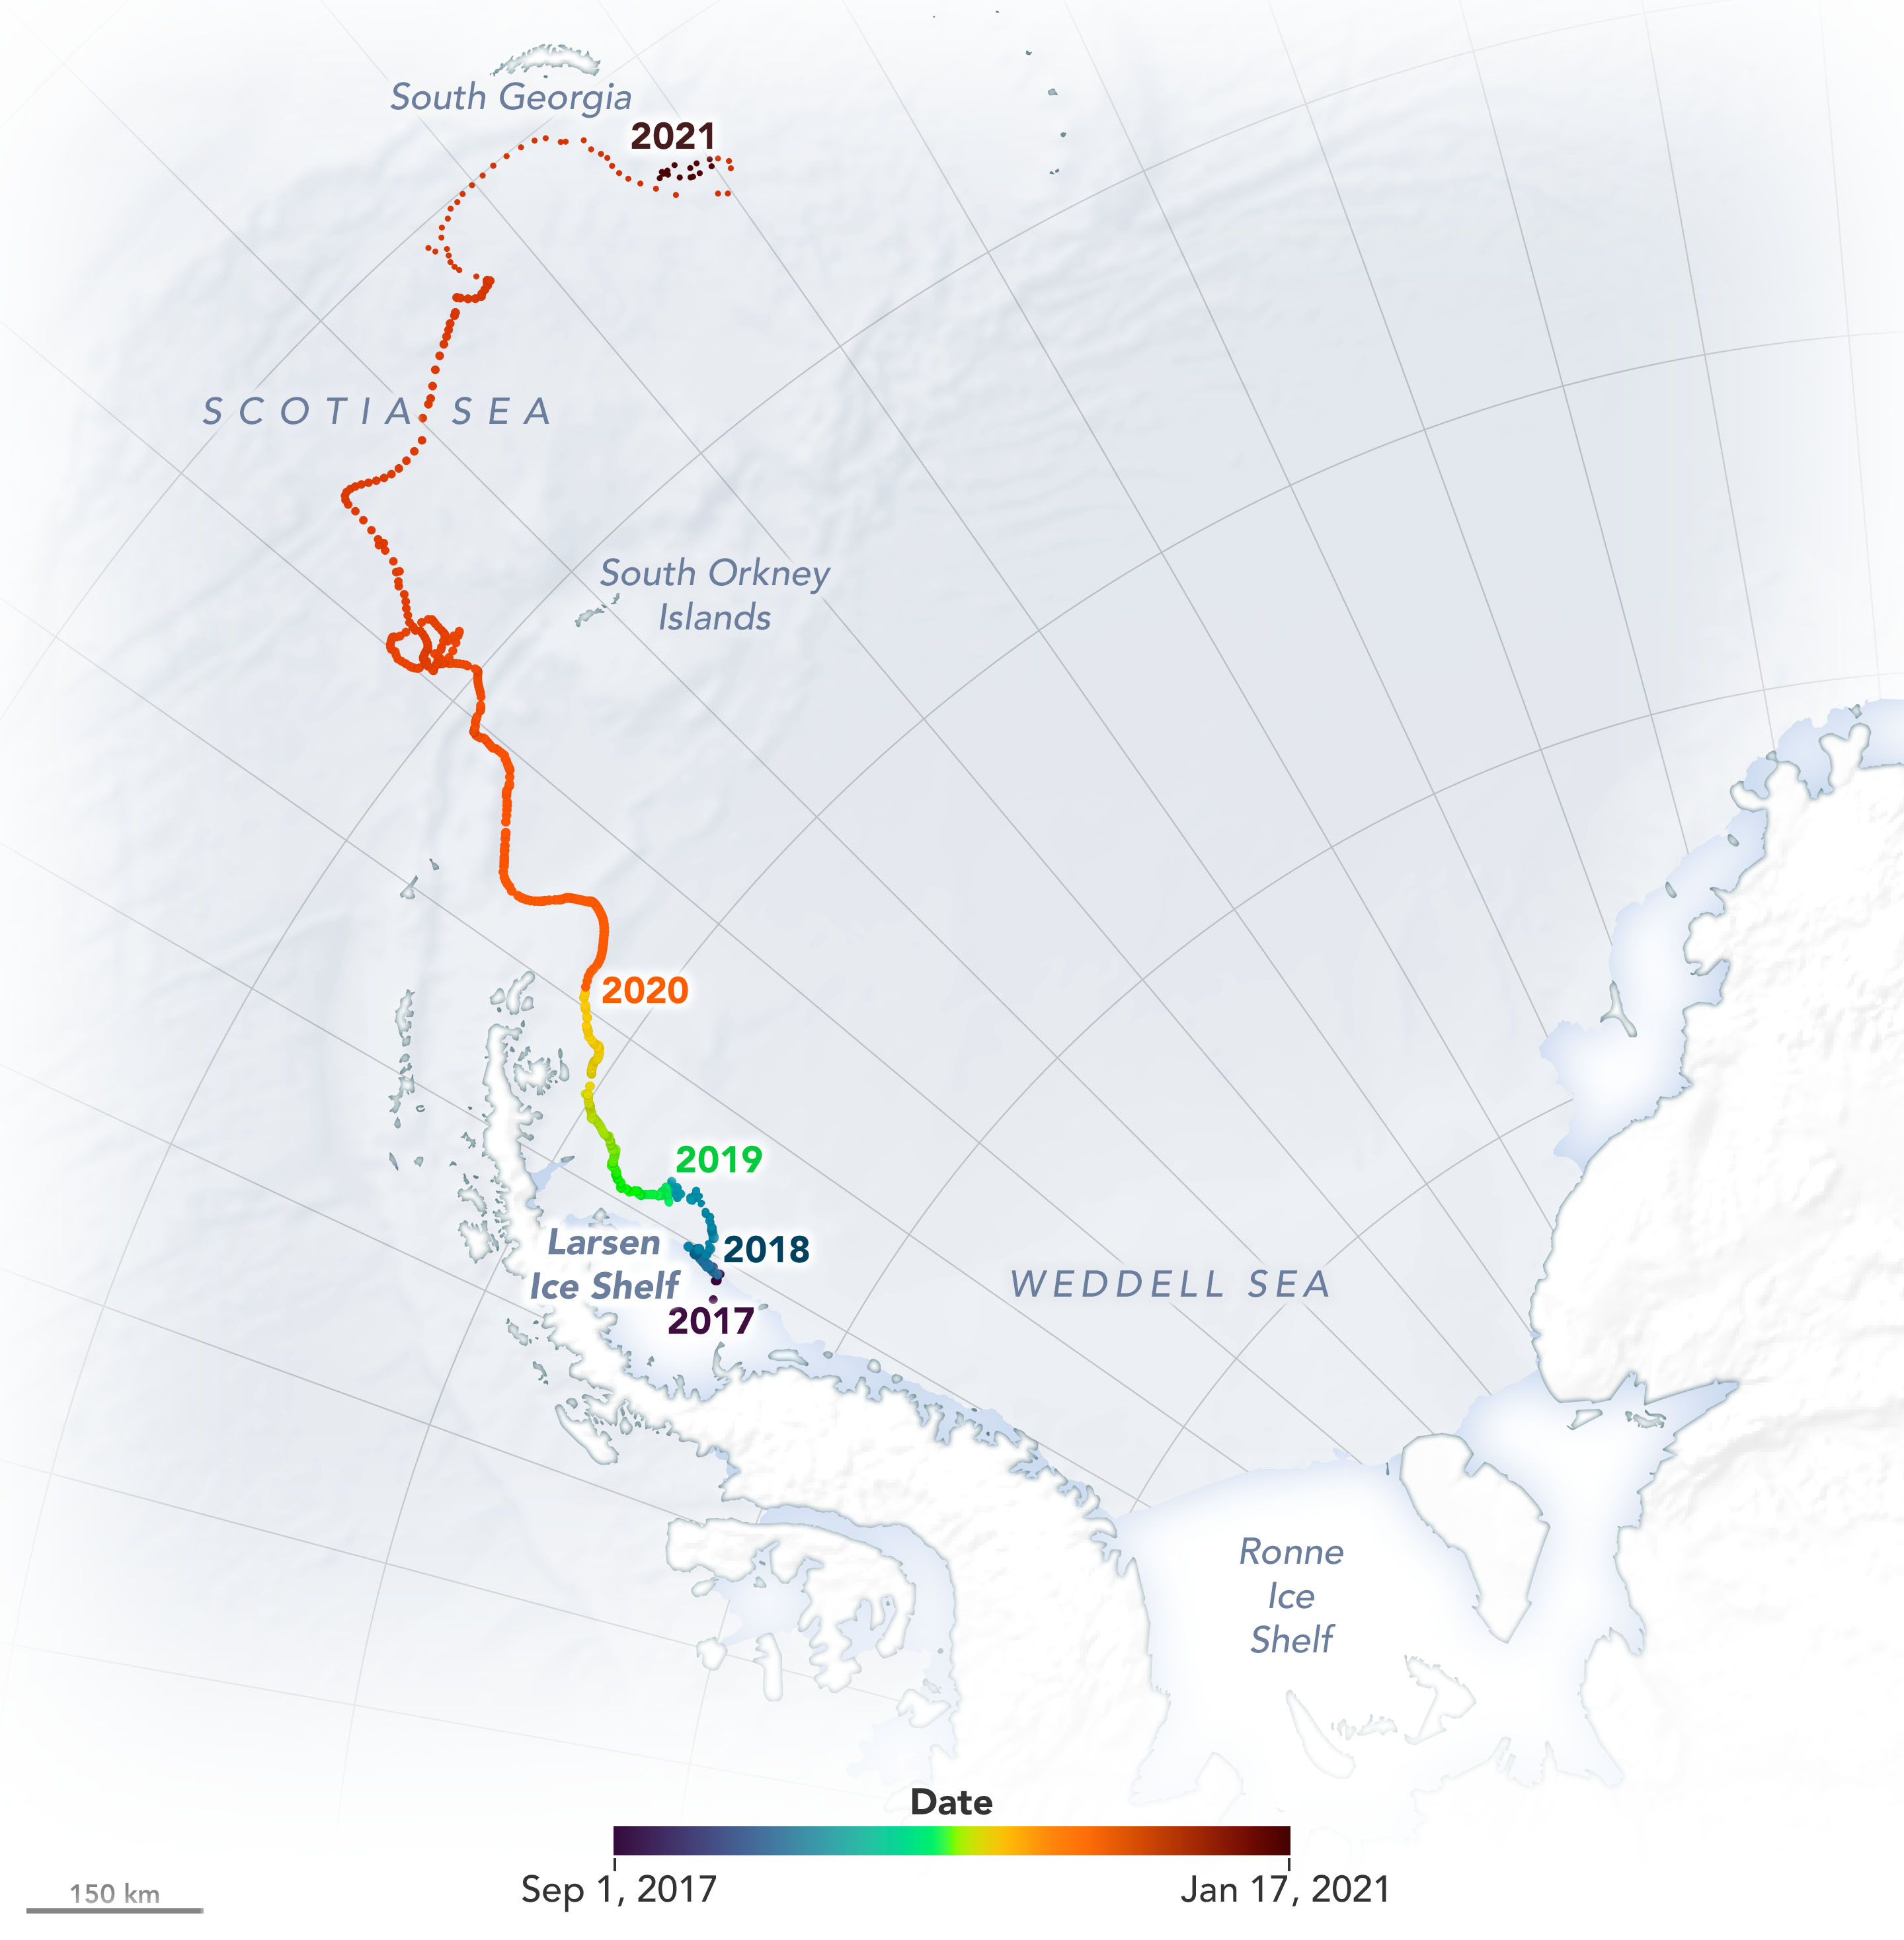
Trajectory of A68A:
The new name was given to the main berg after a few small pieces broke off. The researchers used satellite data to document changes in the iceberg’s thickness, area, volume, and mass from the time it broke from the ice shelf in July 2017 until it started to quickly disintegrate in January 2021.